Individual Maps
The Individual Maps are a valuable feature that provides feedback to users based on their individual data analysis, while also engaging them with the app to gather more consistent data day to day.
There are four different types of maps: suspected triggers (purple outline), triggers (solid purple), protectors (solid blue), and factors with no association (solid grey).
VML (Visual Migraine Language) factors are displayed using colour-coded representations on each map, enabling users to easily identify which factors are strongly associated with their migraines. By tapping on each factor, users can access to more detailed information.
This data help patients and clinicians identify potential factors and make lifestyle changes to better manage migraines.
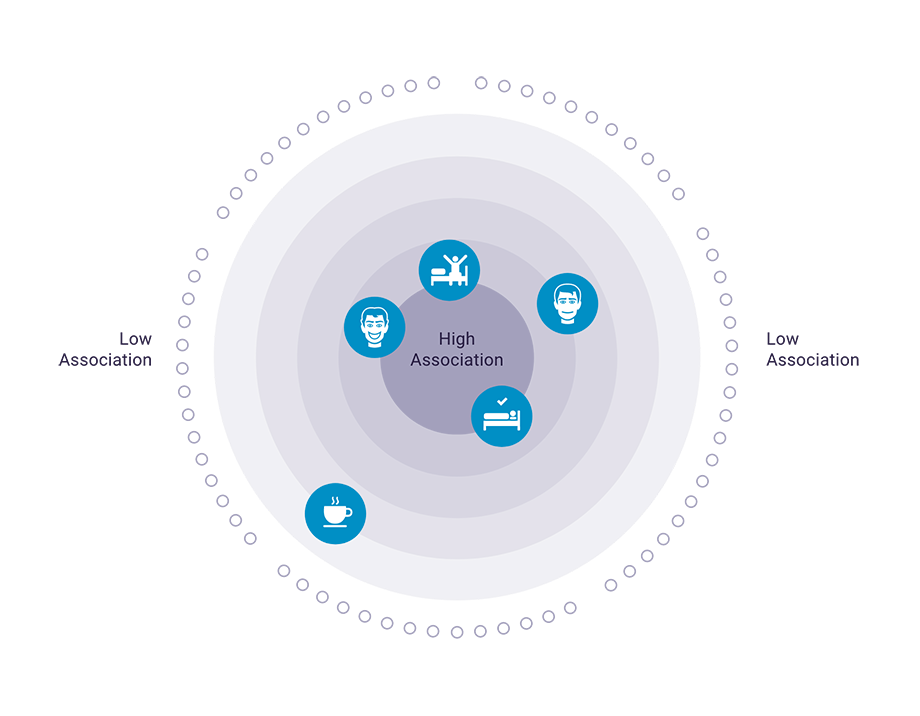


Population Map
The Population Map is a visualization that displays the results of different studies conducted in collaboration with the National Headache Foundation (NHF) and Migraine Trust Association, among others. It provides valuable insights about potential triggers and protectors to clinicians and stakeholders interested in analysing big data.
The map shows how different factors are associated with migraines on a population level, and also displays which potential factors each patient has individually.

Pez Plots
This visualization shows two columns of about 70 factors that may be associated with either migraines (left) and headaches (right) in an individual patient.
The colour of the bar (or Pez pill) is either purple for triggers (factors associated with higher risk of an attack) or blue for protectors (factors associated with lower risk of an attack). The length of the bar represents the strength of the statistical association (ranging from p <= 0.5 to p <= 0.001).

These three visualizations are just a few examples of the many visualizations that we developed at Curelator.
These tools provide useful information for patients, clinicians, and other stakeholders interested in individual and population data. However, we have several other visualizations that are patent pending or under confidentiality agreements and cannot be displayed in my portfolio.